How to Tell Stories with Data for Fun and Profit
Data analysis was one of my previous team's core responsibilities. Our data analysts turned complex questions from business stakeholders into database queries. Then they turned the resulting data into simple and beautiful graphs. We prided ourselves on helping our stakeholders make solid business decisions. We enabled our business to support more commuters in emerging markets to navigate public transport.
But several months ago, our Head of Product was telling me in our 1:1 that he was not completely satisfied with our work. He felt our team was not providing him with the strategic support he needed. His challenge to us: Provide the product team with more proactive advice and suggestions rather than just answering their questions.
This feedback hit us deeply. It told us that we are not contributing as much to the company as we wanted to.
The feedback also confused me for several weeks. After all, our data analysts were analyzing data for him. Defining metrics to measure what our commuters are doing with our mobile app. Building dashboards that provide insights into our product performance. That is their job, isn’t it?
Understanding the Past is not Enough
I stumbled over the answer to my confusion in a book called "DataStory" by Nancy Duarte. It is not one of the frequently cited books on communicating data, but I believe undeservedly so. Duarte founded a presentation design company and has published several great books on different aspects of successful business presentations.
In the book’s intro, she says:
„Data is limited to recording the past by cataloging numerical artifacts of what has happened. Seeking historical truth is vital to good decision-making, and those who work with data are, by nature, truth-seekers. Yet, as you grow into leadership positions, you’ll spend most of your time communicating about the future state others need to create with you. Communicating data shapes our future truth—our future facts. Communicating it well is central to shaping a future in which humanity and organizations flourish.“
Nothing has ever clarified the role of an analytics team to me as much as those four sentences. It is not about explaining the past, but about helping the leaders of our company identify what future our company should move towards.
I suddenly understood the success of our analytics manager at SoundCloud. Most of our team was mystified by him. He wasn’t the most statistically sophisticated data analyst in our team. Nor was he the most rigorous. But he did consistently get more of his findings implemented than anyone else.
Where other analysts in the team lamented their lack of influence on the business over drinks, he was loved by our product and growth teams. And senior leaders trusted him. His secret: He understood our product inside-out and was intensely passionate about making it better. That passion pushed him to consistently turn his analytical findings into concrete, simple proposals and argue for them persuasively.
Analytical insight doesn’t exist in a vacuum. The popular label „data science“-, misleads us to believe that in analytics, just as in science, the insight is the end goal. Once we present our findings based on rigorous analysis, accounting for the quirks and limitations of our data and statistical methods, we might believe our job is done. It is not. In Duarte’s words, businesses don’t need to understand the past, they need to shape the future. And for that, insight is not enough. We also need action.
A Model That Links insight and Action
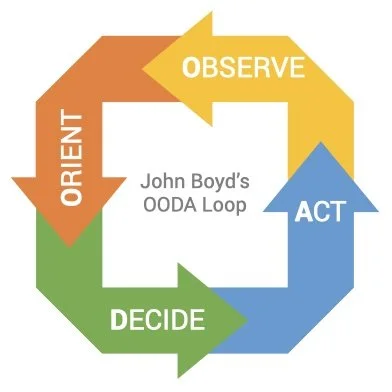
John Boyd’s "OODA Loop“ is one model that links insights and action. He originally proposed it as a model of a tactical feedback loop in the military, and it has since been applied to other domains, including business.
OODA stands for the steps of the loop:
Observe: Building a picture of the situation, as accurate and complete as possible
Orient: Synthesizing information to develop a point of view on the situation and figure out what it implies
Decide: Based on our evaluation of the situation, select actions to pursue
Act: Change the situation
All of these steps are linked via feedback mechanisms.
What data analysts commonly provide to business leaders is charts, i.e. an opportunity to observe by looking at data how the business is evolving. We often pride ourselves on providing "actionable" insights, i.e. charts that suggest an action. However, according to the OODA model, observations don't suggest actions. Decisions do, and those are themselves based on orientation.
There are actually two process steps missing if we want to jump straight from observations into action. No wonder that we don't achieve the impact we desire with our dashboards and reports!
It is exactly these two process steps that our Head of Product wanted my team to assist his team in. He wanted us to help them orient themselves to the meaning of the data and take decisions to act on.
Closing the Insights-Action Gap Through Storytelling
To provide orientation, we need to identify the opportunities or risks to the company that our analysis suggests. What would the future look like if we…
Fix a problem that our data suggests?
Amplify a positive trend by doing more of it?
Counteract a negative trend by stopping a harmful activity?
If we can quantify the answer to these questions, we develop what Duarte calls a "DataPOV". For example, "Changing our shipping policies could increase sales by 40%" qualifies as a DataPOV. We arrive at a specific recommendation with a measurable impact prediction. A vague recommendation such as "Fix our online shopping cart" does not qualify as a DataPOV.
The DataPOV is the core of Duarte's DataStory model. To present a data insight, she recommends the following structure inspired by classic story-telling structures:
Situation: Begin by introducing the main actors and the circumstances they are in. This is your typical "current state" data analysis.
Complication: In the middle of the story, things get messy. What developments require the main actors to take action? This is the central conflict the main actors face.
Resolution: How can the actors overcome the complication? This is the DataPOV, the recommended action.
Duarte illustrates this structure with the story of Pinocchio:
Situation: A toy maker creates Pinocchio, a wooden puppet, and wishes he would be real.
Complication: Pinocchio becomes alive, but needs to prove he is worthy of becoming a flesh and blood boy. He gets involved in several adventures and starts telling a lot of lies that make his nose grow long.
Resolution: Pinocchio returns to his father, who had been swallowed by a whale while searching for Pinocchio. Pinocchio helps his father escape the whale and dies in the process. For his selfless sacrifice, he is worthy of being brought back to life as a "real" boy.
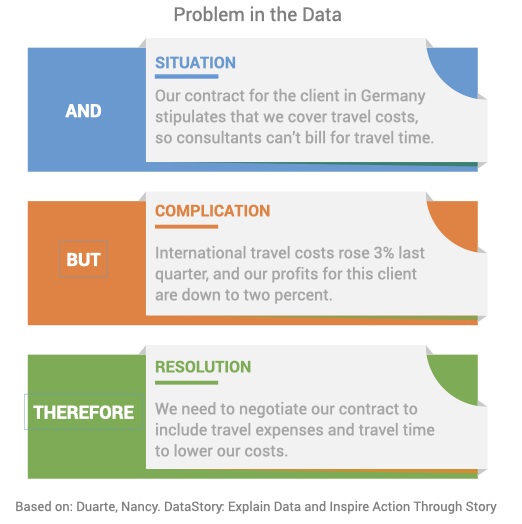
Randy Olson, a scientist who turned filmmaker, compressed the narrative structure even more into the memorable acronym "ABT": And-But-Therefore. His book "The Narrative Gym" is a very accessible and succinct manual on building narrative intuition. It provides templates for how to construct and organize each of these narrative elements. This is particularly helpful to analytical folks like myself who are not born with a story sense.
"AND" sets up the situation and introduces stakes.
"BUT" provides the complications, the conflict.
"THEREFORE" introduces the resolution, the way to solve the conflict.
But how can we use this narrative structure in data analysis? Duarte provides two examples, one for a problem in the data and one for an opportunity in the data.

This model is beautifully simple to understand and apply. I'm excited to see how it will help my team partner with our Product team in new ways.
By leaning into the space of orientation and decision, by recommending actions for our stakeholders to take, we're taking more risks. But taking on more risk with the rest of the business is what will ultimately increase our influence and impact as data analysts. It is what will help us grow in our career and make our jobs more meaningful at the same time.